
This tutorial will walk through each part of the prior configuration Google Sheet, detailing the way to format things and the possible values. The goal of this is not to provide guidance on how to choose priors, only on how to tell us what your priors are once they’ve been chosen.
🛑 If you’re not sure how to choose these priors, please read this document first.❗
If you want ideas about how we ask for this information from clients, see here.
The filled out example sheet for demo can be found here.
Model Info Tab
Fields:
-
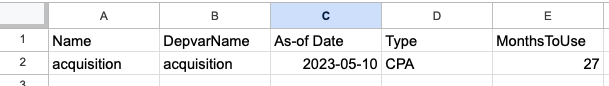
Name - The model name. This will be used to ensure your run is linked to the proper dashboard in the Recast app. We will establish this name during onboarding and you will use the same name for every run that should end up in that dashboard. Changing this name without coordinating with Recast will result in model run errors.
-
DepvarName - This is to identify which column in your clean data to look for the dependent variable. For convenience, this is often the same as the model name. Currently, this also has to be pre-determined with your Recast team, and cannot change (although this may change in the future).
-
As-of Date - This is typically the date (formatted yyyy-mm-dd) you set your priors. This is used as a reference point (more info can be found in the configuration options documentation). It should be a day in your clean data.
-
MonthsToUse - This is how many months of data to use in your model. If your dataset has more months than MonthsToUse, the oldest days will be trimmed. If it has less, Recast will use all available data.
-
Version - This number can be used to version the models as you try different things. Incrementing the Version number will ensure backtests don't show from models that used previous versions.
Intercept Tab
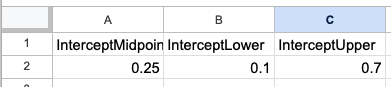
InterceptMidpoint, InterceptLower, and InterceptUpper are the prior bounds you want to set on the proportion of the dependent variable being driven organically. They are typically numbers between 0 (all conversions driven by marketing) and 1 (100% of conversions are organic, not driven by marketing).
The actual priors used in the Recast model are on the dependent variable scale, calculated by taking the median of the last thirty days prior to the As-of-date and multiplying it by the midpoint, lower, and upper proportions provided by the user. Finally, by default the intercept is “auto-widened” so that the percentages you identified are within the prior for all periods in the dataset. These numbers can be seen for a deployed model on the Configure tab.
Channels Tab
One row for each marketing channel in your model.
Fields:
-
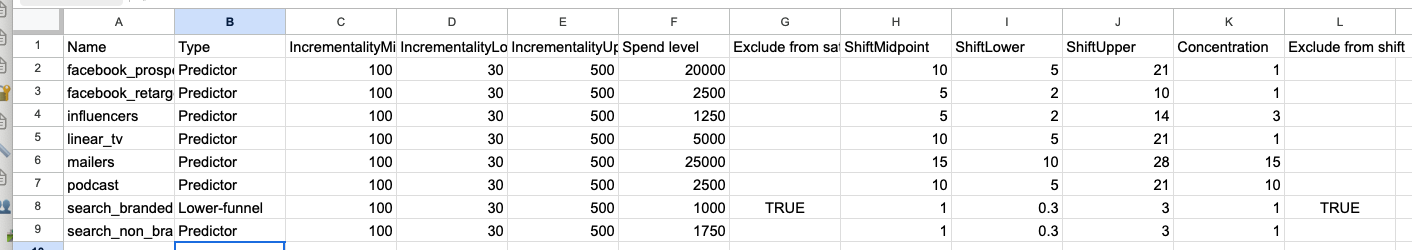
Name - the variable name as it appears in your clean data
-
Type - One of “Predictor” or “Lower-funnel”; distinguishing whether it’s an upper funnel or lower funnel marketing channel
-
Incrementality Midpoint/Lower/Upper - The ROI or CPA prior on the effectiveness of spend
-
Spend level - The level of daily spend that the ROI prior applies to. Typically, a good starting point for this value is the median of the last 90 days of non-zero spend in the channel.
-
Exclude from saturation - either TRUE or blank. Whether or not the channel should be excluded from saturating. If excluded any level of spend will produce the same effect
-
Shift Midpoint/Lower/Upper - The priors on the shift. These bounds are interpreted as the possible number of days before 95% of the effect has been observed
-
Concentration - the concentration parameter. Valid values are 1, 3, 10, and 15
-
Exclude from shift - TRUE or blank, whether to have all the channel’s effect happen on the day of spend or not
-
Units - Blank if the channel is a spend channel, text for any other type of predictor (like 'emails'). Be careful setting ROI priors on these channels, as you'll likely need a much different range than a typical spend channel.
-
Non-Moving TRUE or blank. If TRUE, the channel will be estimated to have a constant performance beta parameter (ROI will still change due to saturation + contextual variable effects). This can be useful for small channels since it reduces the number of parameters in the model (which likely don't have good signal to estimate anyway).
Context Variable Tab
One row for each context variable in your model. Details on what values to choose are laid out here.
Fields:
-
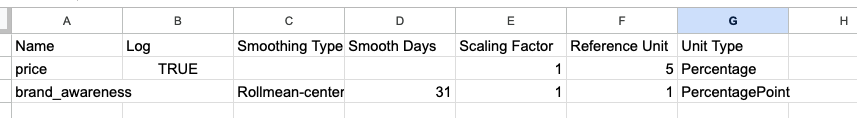
Name - the context variable name as it appears in your clean data
-
Log - TRUE if the value should be log transformed, blank if not
-
Smoothing Type - Blank for no smoothing. Other values are “Rollmean-center”, “Rollmean-right”, “Rollmean-left” and “Loess”
-
Smooth Days - The number of days to include in the smoothing window. Not applicable for Loess
-
Scaling Factor - The number to divide by to put the context variable on the right scale
-
Reference Unit - The number to use as a reference value in the Insights dashboard. See 'Non-modeled Settings' for more information
-
Unit Type - One of “Percentage”, “PercentagePoint”, “Units”, “Currency”, “Binary”
-
Effects Type - One of “Both” (default), “Base only”, “Paid only” - whether the contextual variable should have an effect on baseline conversion, paid conversions, or both.
Note: You should assume contextual variable values will be rounded to 4 decimal places than that. If you need more granularity than that, please scale your contextual variables so that they can be safely rounded.
Spikes Tab
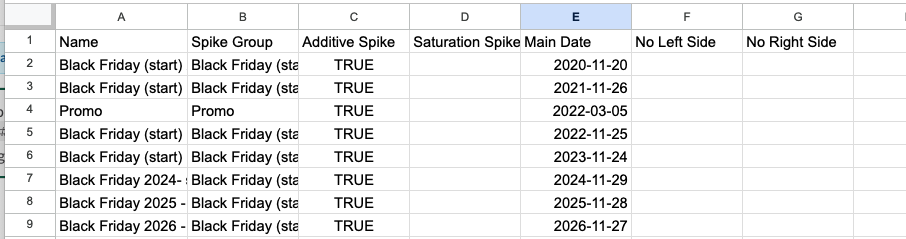
One row for each spike you want in the model.
Fields:
-
Name - The name of the spike. Used exclusively for display in the app, does not impact the model (Spike Group determines how the model is parameterized).
-
Spike Group - What spike group the spike should live in
-
Additive Spike - TRUE to make the spike an additive spike, blank otherwise
-
Saturation Spike - TRUE to make the spike a saturation spike, blank otherwise (note: spikes can be both additive and saturation, and they have to be at least one)
-
Main Date - the date of the spike in yyyy-mm-dd format
-
No Left Side - Set to TRUE to make it so the spike has no effect on the 30 days leading up to the Main Date. Blank and FALSE will allow normal pre-spike effects.
-
No Right Side - set to TRUE to make it so the spike has no effect on the 30 days leading up to the Main Date. Bland and FALSE will allow normal post-spike effects.
Note: All spikes in a spike group must share the same “No Left Side” and “No Right Side” settings.
UpperLowerExclusions Tab
This tab allows you to turn off the relationship between particular upper funnel and lower funnel channels. By default, our model assumes that upper funnel impact will drive lower funnel spend at a fixed, estimated rate. This sheet allows you to force the estimated rate to zero, so that the lower funnel channel predicted spend is unaffected by what's going on in the upper funnel channel.

Fields:
-
Upper Funnel Channel - The name of the upper funnel channel, as it appears in the Channels tab
-
Lower Funnel Channel - The name of the lower funnel channel, as it appears in the Channels tab
Groupings Tab
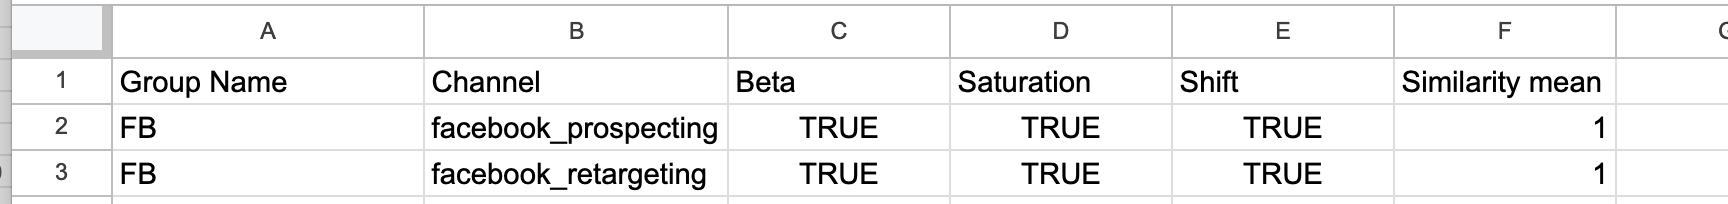
You can use this tab to link channels into hierarchical groups. These links assign a positive correlation to the priors, but do not aggregate them, making the linked channels more similar to each other. You can link the Beta (non-saturated performance), Saturation (rate at which channels saturate), and Shift (time shift). Each row represents one channel in a linked group. Each linked group must have greater than one channel. Multiple linked groups are allowed. The strength of the linking is determined by “Similarity mean.” You can use the following scale to determine which setting to use for similarity mean:
-
>1 basically unlinked (not recommended)
-
0 to 1: light linking
-
-1 to -2: moderate linking
-
-3 or less: extreme linking (basically identical)
Fields:
-
Group name - an identifier that will be used to link up each group, can be anything you choose
-
Channel - the channel you want included in the linked group, name must be present on the Variable tab
-
Beta - TRUE or FALSE, do you want to link the betas?
-
Saturation - TRUE or FALSE, do you want to link the saturation?
-
Shift - TRUE or FALSE, do you want to link the time shifts?
-
Similarity Mean - the parameter controlling the strength of the linking, see chart above.
Note that Beta, Saturation, Shift, and Similarity Mean must be identical for all rows in a single linked group. Different linked groups can have different settings, but different channels within a linked group share their settings.
Incrementality Tests Tab

One row for each incrementality test you want to include in the model. For explanations of all the fields below, please review the Experiments page.
Fields:
-
Name - Name of the test as you want it to show up on the Experiments page
-
Variable - Name of the variable (matches what’s in Variable tab)
-
Start date - Start date of the test, formatted yyyy-mm-dd
-
End date - End date of the test, formatted yyyy-mm-dd
-
Point Estimate - The incremental point estimate
-
Uncertainty - The standard error of the test
-
Type - One of “Average effect” or “Impact”
-
Time - One of “Cumulative”, “Daily”, “Bookend”
-
Include lower funnel effects - TRUE if you want the ROI/CPA estimate to apply to total impact / direct spend instead of direct impact / direct spend. If using type=”Impact” applies the test to total impact
-
Distribution - One of “Strict Gaussian”, “Gaussian”, “Uniform” (blank defaults to “Strict Gaussian”)
-
Cell1 Typical Spend Prop - numeric; only used if Type = “Impact”. See here.
-
Cell2 Typical Spend Prop - numeric; only used if Type = “Impact”.
-
Cell1 Test Spend Ratio - only used if Type = “Impact”.
-
Cell2 Test Spend Ratio - only used if Type = “Impact”.
If multiple channels were part of a single test (e.g. facebook_prospecting and facebook_remarketing), you specify each channel in it’s own row. All columns besides “Variable” must be identical. When Recast reads the Sheet, it will group based on the “Name” column and one multi-channel test will be configured for each unique “Name.”
Version Tab
This indicates the SchemaVersion number. This will be kept up to date on our template sheet and should be left as is. It helps our system know what version of the sheet you’re using.